使用ES、Logstash、Kibana、Filebeat四个容器对Nginx日志分析,生成展示用的热力图
使用ES、Logstash、Kibana、Filebeat四个容器对Nginx日志分析,生成展示用的热力图
使用ELK容器对Nginx做热力图分析
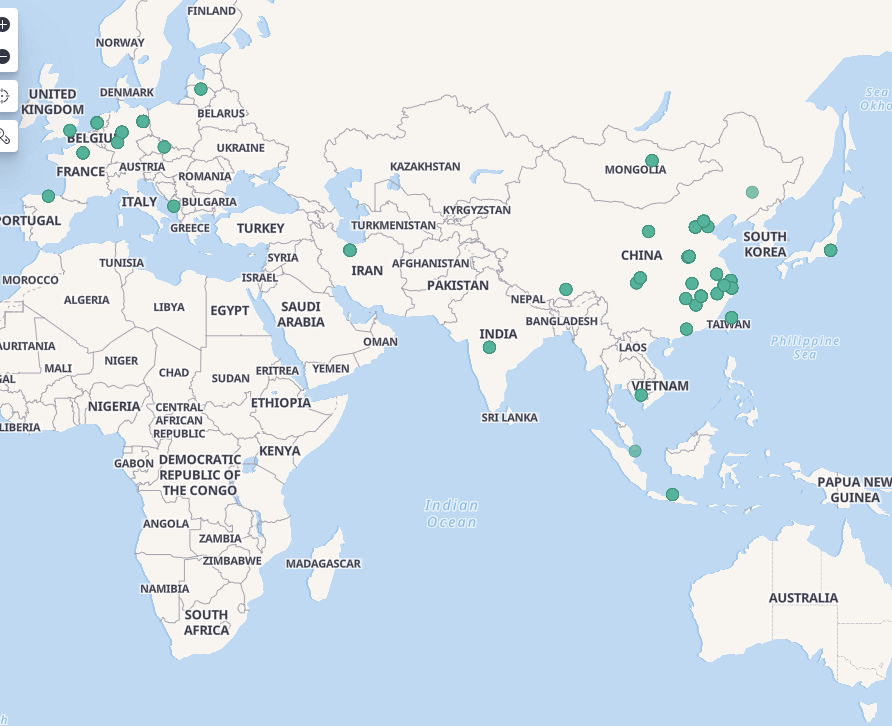
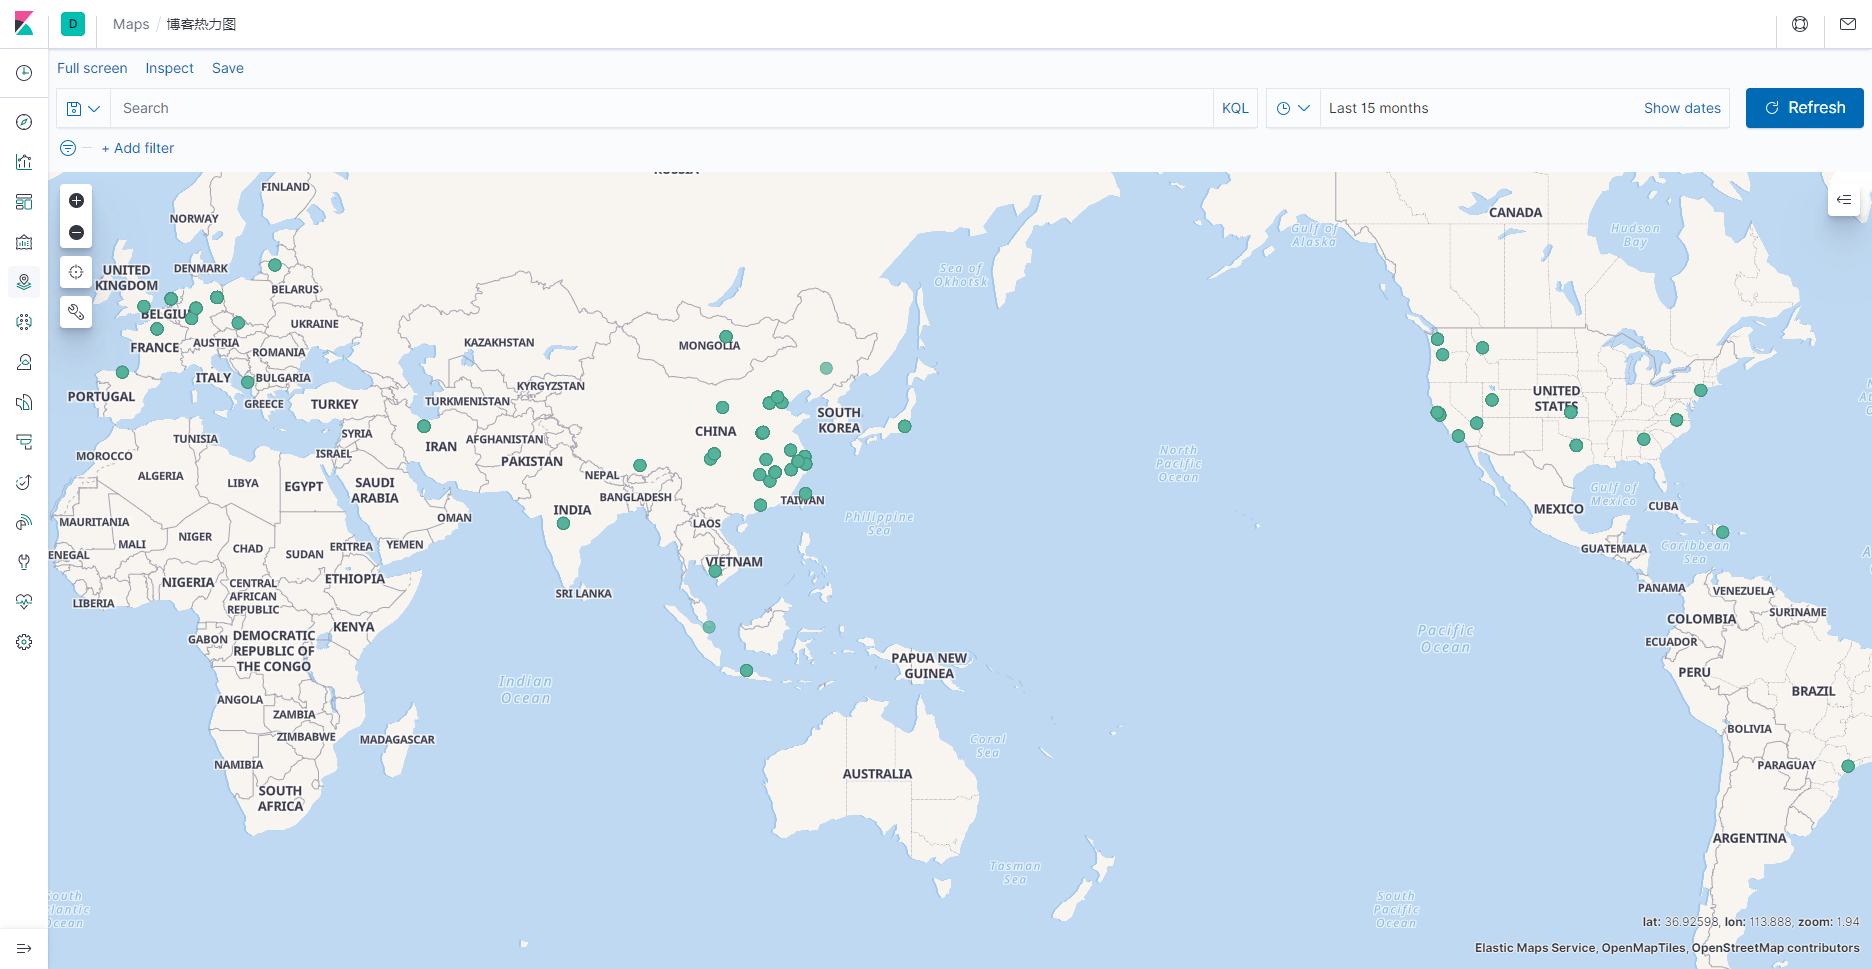
展示
一、总体流程
1.Filebeat获取Nginx的日志并推送给Logstash
2.Logstash对日志数据进行提取分析并利用插件根据ip生成经纬度信息,然后推送给ES
3.ES接收数据并保存
4.Kibana从ES获取数据做热力图
二、安装流程
一、Nginx的配置
转变Nginx的日志格式为JSON格式:
1
2
3
4
5
6
7
8
9
10
11
12
13
14
15
16
17
| http {
log_format json '{"@timestamp":"$time_iso8601",'
'"host":"$server_addr",'
'"clientip":"$remote_addr",'
'"size":$body_bytes_sent,'
'"responsetime":$request_time,'
'"upstreamtime":$upstream_response_time,'
'"upstreamhost":"$upstream_addr",'
'"http_host":"$host",'
'"url":"$uri",'
'"xff":"$http_x_forwarded_for",'
'"referer":"$http_referer",'
'"agent":"$http_user_agent",'
'"status":"$status"}';
access_log /var/log/nginx/access.log json;
...
}
|
重启Nginx
二、Filebeat的安装
创建Filebeat配置(filebeat.yml),记得转化为你自己的地址
1
2
3
4
5
6
7
| filebeat.inputs:
- type: log
enabled: true
paths:
- /access.log
output.logstash:
hosts: ["***.***.***.***:5044"]
|
启动容器
1
| docker run -it -d --name filebeat -v /***/access.log:/access.log -v /***/filebeat.yml:/usr/share/filebeat/filebeat.yml docker.elastic.co/beats/filebeat:7.7.1
|
三、Logstash的安装
创建Logtash配置(logstash_stdout.conf)
1
2
3
4
5
6
7
8
9
10
11
12
13
14
15
16
17
18
19
20
21
22
23
24
25
26
27
28
29
30
31
32
33
34
35
36
37
38
39
40
41
42
43
44
45
46
47
48
49
| input {
beats {
port => 5044
host => "0.0.0.0"
}
}
filter {
mutate {
gsub => ["message", "\\x", "\\\x"]
gsub => ["message", ":-,", ":0,"]
}
json {
source => "message"
remove_field => "message"
remove_field => "[beat][hostname]"
remove_field => "[beat][name]"
remove_field => "[beat][version]"
remove_field => "@version"
remove_field => "offset"
remove_field => "input_type"
remove_field => "tags"
remove_field => "type"
remove_field => "host"
}
mutate {
convert => ["status", "integer"]
convert => ["size","integer"]
convert => ["upstreamtime", "float"]
convert => ["responsetime", "float"]
}
geoip {
source => "clientip"
database => "/***/GeoLite2-City.mmdb"
fields => ["city_name", "country_code2", "country_name", "latitude", "longitude", "region_name"]
add_field => [ "[geoip][location]", "%{[geoip][longitude]}" ]
add_field => [ "[geoip][location]", "%{[geoip][latitude]}" ]
target => "geoip"
}
mutate {
convert => [ "[geoip][location]", "float" ]
}
if "_geoip_lookup_failure" in [tags] { drop { } }
}
output {
elasticsearch {
hosts => ["***.***.***.***:9200"]
index => "logstash-nginx-blog"
}
}
|
下载GeoLite2-City.mmdb
启动容器
1
| docker run -it -d -p 5044:5044 --name logstash -v /***/:/usr/share/logstash/pipeline/ docker.elastic.co/logstash/logstash:7.7.1
|
四、ES的安装
创建ES配置(elasticsearch.yml)
1
2
3
| cluster.name: "my-es"
network.host: 0.0.0.0
http.port: 9200
|
启动容器
1
| docker run -it -d -p 9200:9200 -p 9300:9300 --name es -v /***/config/elasticsearch.yml:/usr/share/elasticsearch/config/elasticsearch.yml -v /***/data:/usr/share/elasticsearch/data -v /***/logs:/usr/share/elasticsearch/logs elasticsearch:7.7.1
|
五、Kibana的安装
创建Kibana配置(kibana.yml)
1
2
3
4
| server.name: kibana
server.host: "0"
elasticsearch.hosts: ["http://***.***.***.***:9200"]
xpack.monitoring.ui.container.elasticsearch.enabled: true
|
启动容器
1
| docker run -d --log-driver json-file --name kibana -p 5601:5601 -v /***/kibana.yml:/usr/share/kibana/config/kibana.yml kibana:7.7.1
|
六、制作热力图
未完待续…
此为博主副博客,留言请去主博客,转载请注明出处:https://www.baby7blog.com/myBlog/100.html